Evaluation of Epidemiological Problem, Diabetes

Abstract
The research topic of the current work is an epidemiologic issue of diabetes in the USA, particularly in Florida. The discussed disease is defined and precisely described. The information is collected from articles in peer-reviewed journals, books, and specialized websites. Much attention is paid to statistical data that depict prevalence and incidence in the territory of the USA and in the chosen state. The statistical information showed the enormous relevance of the discussed issue. The existing methods for surveillance of type 1 and type 2 diabetes are represented by surveys, administrative data systems, laboratory specimens, and sentinel surveillance. Descriptive epidemiologic analyses of both types of diabetes provide a precise understanding of the distinct characteristics of these types of disease. They can be diagnosed by using an oral glucose tolerance test, fasting plasma glucose tests, and A1C test. Screening can be performed by the application of a fasting plasma glucose test, the 75-g oral glucose tolerance test, and the random plasma glucose test. Several recommendations for the addressing of chosen disease are made. They are a guidance of weight lowering, use of metformin, and precise control of people with HbA1c higher than 8 %. The precise description of diabetes and analysis of its epidemiology provides a clear understanding of this issue and methods of its addressing.
Keywords: diabetes, epidemiology, surveillance, incidence, prevalence
Evaluation of Epidemiological Problem, Diabetes
Nowadays much attention is paid to the investigation and analysis of the core community problems. One of these problems will be depicted and discussed in the current work. Diabetes is considered to represent a set of health disorders caused by insufficient insulin discretion and insulin action. This issue is rather relevant because it affects thousands of people every year. In fact, diabetes is considered to be the seventh cause of death worldwide. Diabetes is associated with billions of direct and indirect losses in healthcare and various fields of industry. The current work provides the evaluation of this issue and its representation in Florida. Much attention is paid to the clarification of the background of the disease, depiction of current surveillance methods, providing epidemiology analysis, reviewing screening and diagnosing procedures, and giving recommendations for evidence-based addressing. The understanding of the epidemiology of diabetes and its distinct features enables me to enrich personal knowledge and apply it for solving the health issue of the population in Florida.
Background
General Description of Diabetes
Diabetes can be defined as a group of metabolic disorders characterized by a chronic hyperglycemic condition that results from defects in insulin secretion, insulin action, or both (Ozougwu et al., 2013, p. 46). There are two major types of diabetes: type 1 (also known as insulin-dependent diabetes) and type 2 (also known as insulin non-dependent diabetes) (Ozougwu et al., 2013). The first type of diabetes is caused by insufficient secretion of insulin that is performed by beta cells of the pancreas (Ozougwu et al., 2013, p. 47). The second type of diabetes results from the lowered personal sensitivity of target tissues to insulin or insulin resistance (Ozougwu et al., 2013, p. 47). The major reasons for insulin resistance are the following: increased glucorticoids, overweight and obesity, increased level of growth hormone, mutations of the insulin receptor, etc. (Ozougwu et al., 2013).
Prevalence and Incidence in the USA
The significant relevance of the discussed topic is supported by its enormous prevalence and incidence. In 2012, about 9.3 % (or 29.1 million) of the American population had diabetes (American Diabetes Association, 2016a). The great prevalence of diabetes is observed among the population aged 65 years and older (American Diabetes Association, 2016a). More than 11 million Americans of this age suffered from diabetes (American Diabetes Association, 2016a). However, the representatives of other age groups also suffer from this disease. The incidence of diagnosed diabetes per one thousand people aged from 18 years to 79 years is presented in Figure 1.
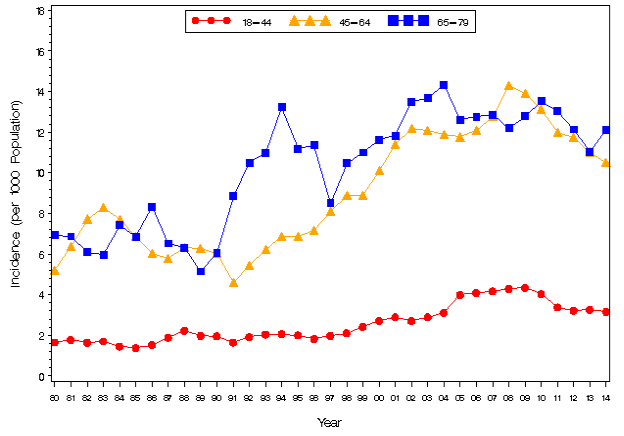
Figure 1. The incidence of diagnosed diabetes per one thousand population aged 18 – 79 years from 1980 to 2014 (Centers for Disease Control and Prevention, 2015)
Additional attention should be paid to the fact that new cases of diabetes are revealed every year. This fact is presented in Figure 2.
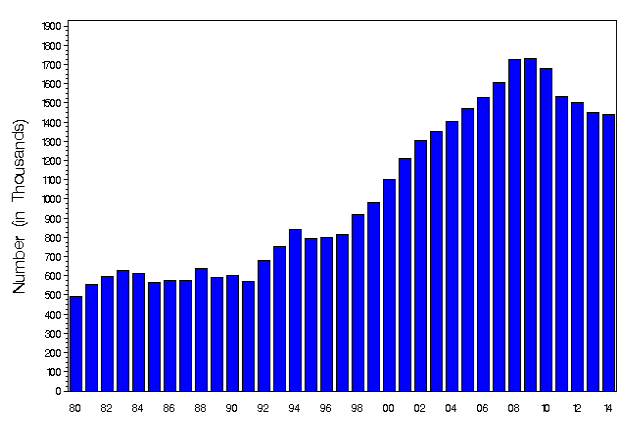
Figure 2. New cases of diabetes in the USA (Centers for Disease Control and Prevention, 2015).
The percentage of incidence of diabetes is almost the same among males and females. This statistics is shown in Figure 3.
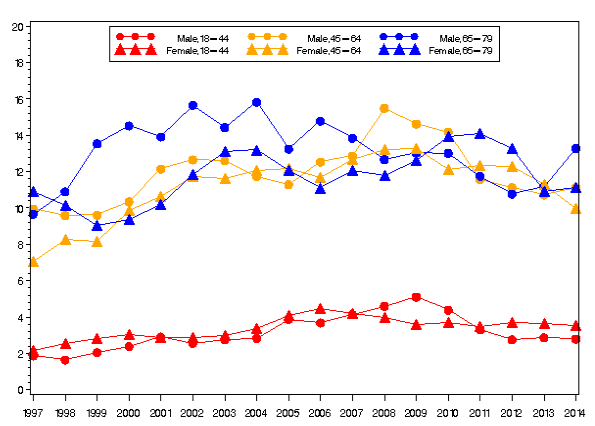
Figure 3. Incidence of males and females of various ages who have diabetes per 1,000 population from 1980 to 2014 (Centers for Disease Control and Prevention, 2015).
The representatives of different nationalities have various incidence rates. Whites suffer from diabetes less frequently than Blacks and Hispanics. This is presented in Figure 4.
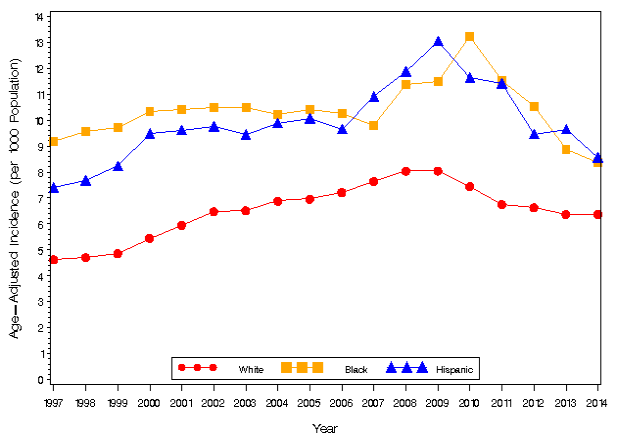
Figure 4. The age-adjusted incidence rate of representatives of various nationalities per 1,000 population from 1980 to 2014 (Centers for Disease Control and Prevention, 2015).
Moreover, Americans of different educational levels have different incidence rates of diabetes as presented by Figure 5.
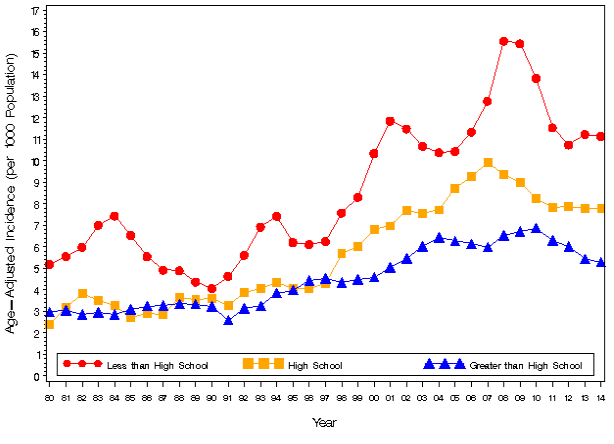
Figure 5. The age-adjusted incidence rate of representatives of various educational levels per 1,000 population from 1980 to 2014 (Centers for Disease Control and Prevention, 2015).
Diabetes in Florida
The discussed health issue represents a significant problem in Florida because this state represents a shelter for 9.4 % of all American adults with diagnosed diabetes (Centers for Disease Control and Prevention, 2014). The percentage of people of different ages who suffer from diabetes in Florida is presented in Table 1 (Centers for Disease Control and Prevention, 2014).
Table 1.
The incidence of diagnosed diabetes per 1,000 population of different ages in 2014
|
Age, years |
The incidence of diagnosed diabetes per 1,000 population, % |
|
18 44 |
2.9 |
|
45 – 64 |
13.9 |
|
65 74 |
22.7 |
|
75 and more |
20.9 |
The percentage of males and females who suffer from diabetes in Florida is almost the same: 9.2 % of males and 9.7 % of females. This figure aligns with the figure that presents the average statistics for the country.
The age-adjusted incidence rate of representatives of various educational levels per 1,000 population in Florida is presented in Table 2. The presented trends align with the average trends in the USA.
Table 2.
The incidence of diagnosed diabetes per 1,000 population of different educational levels in 2014
|
Educational levels |
The incidence of diagnosed diabetes per 1,000 population, % |
|
Less than high school |
14.5 |
|
High school |
9.1 |
|
Greater than high school |
8.1 |
Such a high rate can be explained by several factors. Firstly, 23 % of the population in this state suffers from overweight and obesity; moreover, this figure tends to grow (Trust for Americas Health and Robert Wood Johnson Foundation, 2016). The obesity rate has almost doubled for the last 15 years. This fact is presented in Figure 6.
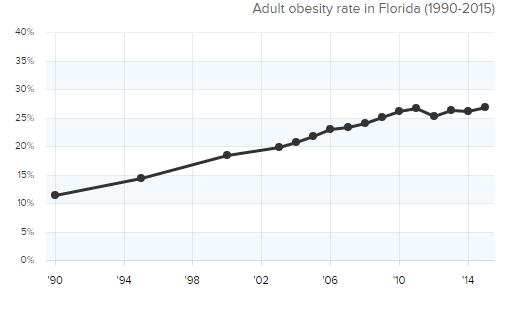
Figure 6. The rate of obesity in Florida from 1990 to 2015 (Trust for Americas Health and Robert Wood Johnson Foundation, 2016).
The second factor is a great number of representatives of minority groups. There are 16 % of blacks and 22 % of Hispanics in the composition of the population of this state (Trust for Americas Health and Robert Wood Johnson Foundation, 2016). In fact, these nationalities have a higher prevalence of diabetes.
The last factor is the fact that Florida is the nation’s fifth-oldest state (Jameson, 2011). The average age in this state is 40 years, while the average age in the USA is 36.8 years (Jameson, 2011). Figure 1 clearly presented the fact that people of older age have a higher prevalence of diabetes.
The Relevance of Discussed Topic
The relevance of the discussed topic is supported by the fact that diabetes is considered to be the seventh disease that causes death in the USA (American Diabetes Association, 2016a). The related complications and co-morbid conditions of diabetes cause enormous harm to patients’ health. The following are possible complications: hypoglycemia, hypertension, dyslipidemia, heart attack, stroke, kidney disease, and eye problems (American Diabetes Association, 2016a). Moreover, the treatment of diabetes poses an enormous financial burden on patients and health care-providing institutions. According to official statistics, the average cost of treatment of patients with diabetes is 2.3 times higher than the average cost of treatment of patients without diabetes (American Diabetes Association, 2016a). Additional attention should be paid to the fact that this figure tends to increase. The total estimated economic cost connected to diagnosed diabetes increased from $174 billion in 2007 to $ 245 billion (Petersen, 2013).
Writing papers seems to be a challenge? Get help from professional research paper writers!
Current Surveillance Method
The surveillance methods represent notifiable diseases, laboratory specimens, vital records, sentinel surveillance, registries, surveys, and administrative data systems (Institute of Medicine (US) Committee on a National Surveillance System for Cardiovascular and Select Chronic Diseases, 2011, p. 65). The data is obtained from the national surveys performed by the National Center of Health Statistics, the U.S. Renal Data System, and from the death statistics (Rothman, Greenland, and Lash, 2008). The national diabetes surveillance performs numerous functions, like tracking incidence and prevalence of this disease, rates of death, hospitalization, the use of emergency services, the application of outpatient services and renal diseases, determination and tracking of diabetes-related health issues, and the use of services directed on the prevention of diabetes (Rothman, Greenland, and Lash, 2008). The following groups of statistical data are collected: age, gender, nationality of people with diabetes, the rate of deaths, the rate of related diseases, the cost of treatment, and the type of diabetes.
The Epidemiology section of Disease Reporting and Surveillance performs the surveillance of diabetes in Florida (Florida Health, n. d.). The employees of this section perform the collection and management of information concerning the cases of diabetics.
Reporting
Usually, people with health conditions that can lead to significantly impaired consciousness are examined to determine their ability to drive safely (American Diabetes Association, 2014, p. 598). In the case of diabetes, such conditions may occur, when a person is affected by hypoglycemia (American Diabetes Association, 2014). In the majority of states, the physician should report this condition to the licensing authority (American Diabetes Association, 2014). In other states, the physicians are provided with the discretion of whether to report about such conditions or not.
In Florida, the applicants for a driving license do not get the questions concerning diabetes (American Diabetes Association, 2016b). However, according to provisions of Fl. Dept. of Highway Safety, Div. of Motor Vehicles, &”2013 Florida Driver’s Handbook,” HSMV 71902, Sec. 2.8, the applicants should inform the authority about the health issues, which may influence driving (American Diabetes Association, 2016b). If a person informed the authority about severe complications connected to diabetes, like peripheral neuropathy, he/ she may be obliged to refer to the medical advisory board of Florida. According to Fla. Admin. Code Ann. r. 15A-1.010(1), the drivers may be required to perform medical evaluation if the employees of the licensing agency noticed some severe impairments during a medical evaluation (American Diabetes Association, 2016b).
There is no regulation that mandates the physicians to report to a central state agency about the drivers with health issues, which may affect their driving. Health care providers can report this information only to the patients and this information is confidential, according to Fla. Stat. 322.126(3): the reports authorized by this section shall be confidential(The Florid Legislature, 2016)). According to Fla. Stat. 322.126(4) (2013), this information may not be used as evidence in any civil or criminal trial or in any court proceeding (American Diabetes Association, 2016b)
Epidemiologic Analysis and Costs
Epidemiology
The current work will provide epidemiology analyses for type 1 diabetes and type 2 diabetes. In fact, people, who have type 1 diabetes, are often less than 20 years old (Ozougwu et al., 2013). They have low or decreased body mass, low or zero levels of plasma insulin, and normal insulin sensitivity (Ozougwu et al., 2013). People, who have type 2 diabetes, are usually older than 30 years (Ozougwu et al., 2013). Moreover, they tend to suffer from obesity. Their level of plasma insulin is normal or initially high while insulin sensitivity is decreased (Ozougwu et al., 2013). In both types of diabetes, health care providers can observe an increased level of plasma glucose in the combination with a high or even suppressed level of plasma glucagon (Ozougwu et al., 2013). The major therapy for the patients with type 1 insulin involves obtaining insulin, while the major therapy in type 2 insulin is decreasing body mass, thiazolidinediones, metformin, sulfonylureas, insulin (Ozougwu et al., 2013, p. 47).
Costs
The cost connected to the diagnosed diabetes was equal to about $ 245 billion ($ 176 billion of direct medical costs and $ 68.6 billion indirect costs) in 2012 (Petersen, 2013). The biggest components of these expenses are the following: impatient care (43%), treatment of diabetes related complications (18 %), antidiabetic agents (The Florid Legislature, 2016), visits to the office of the physicians (9 %), and stays at nursing and residential facilities (8%) (Petersen, 2013). The patients with diabetes spend about $ 13,700 annually (Petersen, 2013). Expenses connected to absenteeism, reduced productivity, inability to work because of disability caused by diabetes, and loss of productivity because of early mortality represent indirect costs of diabetes (Petersen, 2013).
Moreover, these costs include expenses on treatment of complications connected to diabetes. The distribution of medical expenditures is presented in Figure 7.
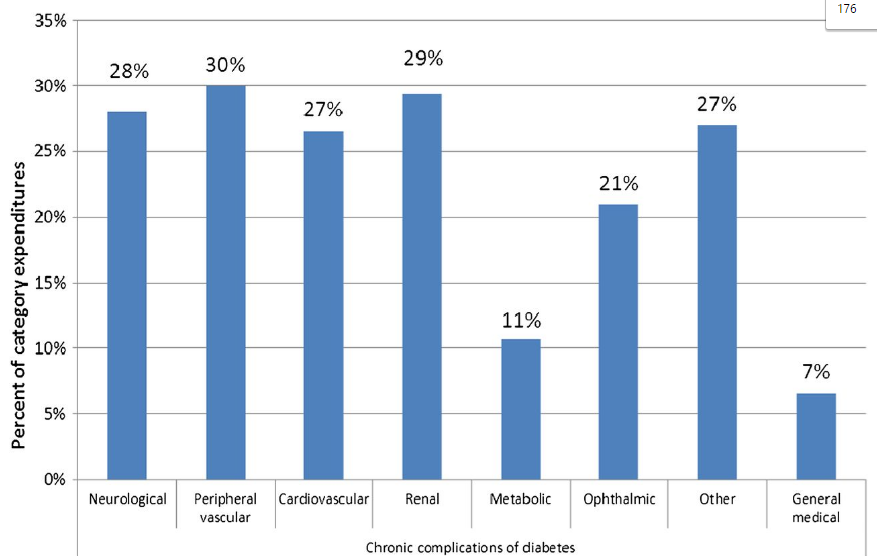
Figure 7. The distribution of medical expenditures on treatment complications connected to diabetes (Petersen, 2013).
This figure shows that the major part of finances is usually dedicated to the treatment of peripheral vascular, renal, and neurologic.
Diagnosis and Screening
Diagnosing
Diagnosing is performed by taking the blood sample and sending it to the laboratory for analysis. The following tests can be used for diagnosing: an oral glucose tolerance test, a fasting plasma glucose test, and an A1C (also known as glycohemoglobin or hemoglobin) test (National Institute of Diabetes and Digestive and Kidney Diseases, n.d.).
The current work will focus on the analysis of A1C test. In fact, this type of tests is recommended for the identification of type 2 diabetes. This test shows the average glucose level during the past 3 months without specification of fluctuations of this level during the day (National Institute of Diabetes and Digestive and Kidney Diseases, n. d.). Actually, this test can be performed at any time of the day. The report provides the percentage of glucose level. The average normal glucose level is 5.7 % (National Institute of Diabetes and Digestive and Kidney Diseases, n.d.). This figure is rather relevant because the average glucose levels aligned with A1Cs showing the validity of the A1C test (Gebel, 2013). The indication of type 2 prediabetes by this test ranges from 5.7 % to 6.4 % (National Institute of Diabetes and Digestive and Kidney Diseases, n.d.). The recommended cutoff point for the use of this test is ? 6.5% (Exebio et al., 2012). The positive predictive value is 63 % (FPINs Clinical Inquiries, 2006). This test can be unreliable for the identification of diabetes of people, who suffer from specific diseases, like thalassemia, chronic kidney disease, and anemia (National Institute of Diabetes and Digestive and Kidney Diseases, n. d.).
Screening
In contrast to diagnosis, screening is performed with the aim to determine asymptomatic patients, who are at a high risk of having diabetes (American Diabetes Association, 2002). This can be achieved by using the fasting plasma glucose test (also known as FPG), the 75-g oral glucose tolerance test (OGTT), and the random plasma glucose test (RPG). The first test is cheaper, has fewer complications, and requires less time than the second one. At the same time, FPG is less sensitive than OGTT. If the first tests shows
The current work will focus on the depiction of FPG test. The distinct validity characteristics of this test are the following: sensitivity of 93.47 %, specificity of 99.68 %, and the positive predictive value is 93.47 % (Gupta et al., 2016). This test can be unreliable if the appropriate preparations have not been performed, i.e. if the person consumed food during the 8 hours before the test performance (Gupta et al., 2016).
The most sensitive screening test is random plasma glucose of 100 mg/dl (Herman, 2007). This test showed a low amount of false tests after the performance of the first screen (Herman, 2007). The random plasma glucose of 160 mg/dl is less sensitive as it shows an eight times higher number of undetected diabetes cases during the first test (Herman, 2007). The random plasma glucose of 130 mg/dl has moderate sensitivity and high specificity at the same time (Herman, 2007). These statements can be explained by the existence of a trade-off between sensitivity and specificity (Gordis, 2014, p. 94).
Addressing Diabetes
Diabetes can be addressed by numerous interventions. The first intervention represents the guidance of the weight decrease through lowering of caloric intake, an increase of physical activity, and giving insulin. Sujata Sapkota, Jo-anne E. Brein, Jerry R. Greenfield, and Parisa Aslani (2015) evidenced the effectiveness of this intervention. The outcomes can be measured by the extent of weight loss and the number of mg/dl.
One more intervention represents the use of metformin. The evidenced result of this intervention is a decrease of 25-31 % in incidence among the patients at high risk (Narayan et al., 2006). The outcomes can be measured in the same manner as the outcomes of the first intervention.
The last intervention represents the additional control of people with HbA1c higher than 8 %. This intervention can lead to a reduction of 30 % in microvascular disease per 1 % drop in HbA1c (Narayan et al., 2006, p. 594). The outcomes can be measured in the same manner as the outcomes of the previous interventions.
Conclusion
To summarize, the current work provides the definition and description of various types of diabetes. This disease refers to the group of metabolic disorders caused by the inappropriate secretion and action of insulin. There are two types of diabetes: type 1 and type 2. While type 1 diabetes is more common among the younger population, who has insufficient insulin secretion, type 2 diabetes can be identified among the older population, who has decreased insulin resistance. Diabetes is more common among the representatives of non-White nationalities with uncompleted high education of older ages both in Florida and in the whole country. The relevance of the discussed topic is supported by several facts. Diabetes is considered to be one of the major causes of death in the USA. This disease is connected to numerous health issues and significant direct and indirect costs. Diabetes can be diagnosed by the application of an oral glucose tolerance test, fasting plasma glucose tests and A1C. Screening of this disease is performed by using FPG, OGTT, and RPG. The final section of this work contains evidence-based propositions directed on addressing diabetes. These propositions represent weight guidance, use of metformin, and additional control of individuals with HbA1c higher than 8 %.